While some pundits have announced the recession is over, the electronics supply chain has a different view. VentureOutsource.com completed the second version of its Electronics Supply Chain Business Outlook Survey for 2009, asking its readers to comment on the current economic situation, from their perspective in the electronics supply chain. The survey was sponsored by IDC.

According to those surveyed, the near-term future outlook is not so bright and they expect the market to continue to bump along the bottom into 2010.
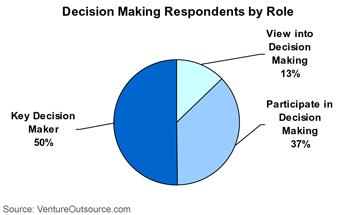
A Future Index built by responses to several questions from the survey came in at a mean of 5.1 on a scale of 1 to 10, just slightly higher than their opinions about the current environment. On average, key decision makers for their organizations, who made up 50% of survey respondents, see the macro environment improving, but are still worried about the level of business activity or volume.
The survey ran for six week ending August 21 and generated responses from 292 people. Respondents were asked 12 questions about their expectations regarding the current and future business environment; employment, business volume, and product pricing environments.
Survey respondents were asked to rate their views on these questions on a scale of 1 to 10 (1 being the most negative and 10 for the most optimistic response). VentureOutsource.com conducted a similar survey in April (see April survey results), asking the same basic 12 questions.
The survey also asked respondents to describe the type of company they work for; what product areas their business unit or corporation are active in; their role in the decision making process; and what level they can speak to (business ‘units’ versus overall corporation).
Tables 1 through 3 show the number of respondents by their type of company versus three other demographic categories. Twenty five percent more respondents completed this recent survey, compared to the April survey. Respondents from electronics manufacturing services (EMS) and original design manufacturers (ODM) and OEMs constituted 82% of the respondents, up from 60% in the previous survey.
Table 1: Survey Response by Electronics Company Type, Product Area

Table 2: Survey Response by Electronics Company Type, Decision Making Role
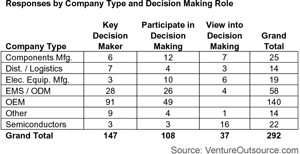
Table 3: Survey Responses by Electronics Company Type, Business Level
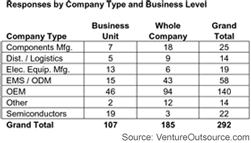
In this latest survey there were also more respondents from component manufacturers (i.e., printed circuit board companies, sheet metal fabricators and connector organizations, etc…). Electronic equipment manufacturers and semiconductor firms constituted a smaller share of total respondents.
Twenty percent of respondents identified computer / PC as the primary product area for their company and 13% identified servers as the primary product area. These numbers were up from the last survey. The share of respondents from telecommunications and networking firms held about constant with 20% and 3%, respectively. Consumer devices remained the smallest class of respondents at 3%.
In the August survey, half of all respondents identified themselves as “key decision makers” in their companies, up from 11% from the previous survey. Those respondents who “participate in decision making” remained about constant, at 37%. On the other hand, those with a “view into decision making” made up a smaller proportion of respondents, at just 13%, down from 18% in April. This should prove significant in analyzing the results of this survey, as approximately 87% of the 292 survey respondents are active participants in the supply chain decision making processes of their companies. (See Figure 1)
Fig.1: Survey Respondent Decision Making by Role
The mix of respondents answering for their whole company versus their business unit remained about constant. Sixty three percent of respondents said their answers pertain to their company while 37% indicated their responses relate just to their business unit.
Overall, respondents’ outlook on the state of electronics supply chain has remained constant since April 2009.
Figure 2 shows the average score for three indexes calculated by averaging each respondent’s responses to different sets of questions:
- Current Index — The average of each of the respondent’s scores for their current outlook regarding the economic situation; employment, inventory levels, business volume, and prices.
- Future Index — The average of each of the respondent’s scores for their expectations regarding the economic situation; employment, business volume, and profits.
- Overall Index – An average of the two indices above.
Fig. 2: Electronics Supply Chain Outlook: Spring vs. Summer 2009 Survey Results
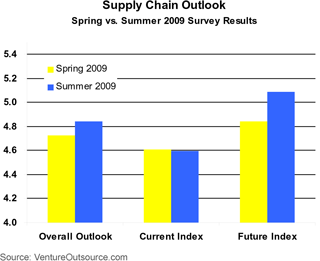
Overall, respondents view the current situation as they did in April, with an average score for the Current Index of 4.6 out of 10, the same as four months ago. Also, as before, respondents were slightly more optimistic regarding the future, as the Future Index came in at 5.1 out of 10, 5% higher than in April and 10% higher than the Current Index.
This indicates a meaningful increase in optimism about the future, yet still no sign of irrational exuberance, or even a serious recovery before the end of 2009.
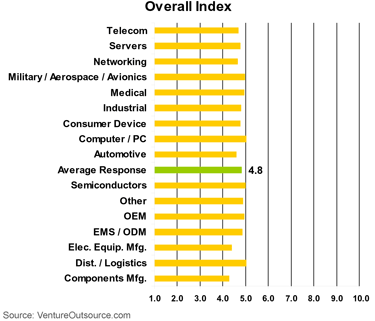
The Overall Index, an overall measure of respondents’ opinions on the state of the supply chain, remained essentially flat at 4.8. The morass of the current market is wide felt, as shown in Figure 3, with little variation by end-market or by company type. Only component manufacturers and electronic equipment manufacturers diverged from the pack, providing lower scores on average, 4.3 and 4.4, respectively.
Fig. 3: Electronics Supply Chain Overall Index by Company Type, Product Area
The elements of the Current Index are presented in Table 4. Respondents were most pessimistic regarding the economic and employment situation, with average scores of 3.9 and 4.3 out of 10, respectively. These scores were also a little worse than in April. Respondents felt better regarding inventory levels increasing, with a mean score of 4.6, down 0.3 points from the last survey.
Table 4: Average Responses for Current Index and Constituent Elements

Attitudes toward business volumes, shipments or orders, as appropriate to the respondent, were stronger this time around and when compared to the average Current Index score. Yet, they still feel we are stuck in neutral, with an average score of 5.0. Respondents also believed that no new increases in prices are expected at this time, providing a mean score of 5.1 points.
Component and electronic equipment manufacturers provided the lowest mean scores, as shown in Figure 4. Also, respondents who address the automotive industry tied for the lowest view of the current situation, providing a mean score of 4.3, with the networking end-market segment also coming in with a score of 4.3 out of 10.
Fig. 4: Electronics Supply Chain Current Index by Company Type, Product Area
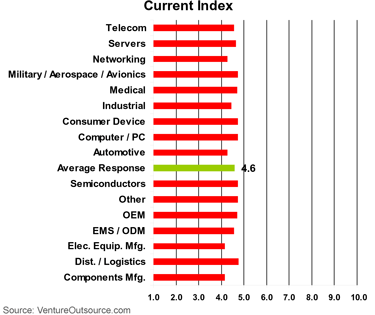
Given the fluctuating demand as OEMs and electronics contract manufacturers try to limit inventory costs, it is not surprising that component manufacturers have the lowest Current Index scores. As for electronic equipment manufacturers, their low scores likely reflect the capital cost controls manufacturers have employed to weather the current recession.
The Future Index increased to 5.1 out of 10, an improvement over the last survey and the Current Index. Table 5 contains the elements that combine to form the Future Index and shows there is little variation in how respondents answered each specific question.
Table 5: Average Responses for Future Index and Constituent Elements
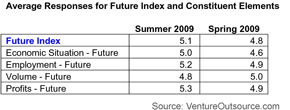
It appears respondents were a bit more optimistic regarding the future employment situation and profits, with mean scores of 5.2 and 5.3, respectively.
The real news is the nearly ten percent increases in respondent attitudes in the August survey compared to VentureOutsource.com’s survey four months ago.
Feelings regarding the future economic situation averaged 5.0, up 9% from the last survey. The one area for concern was the business volume question, which had a mean score of 4.8, 5% below the Future Index score and down slightly from the previous survey. In the end, though, these results show a belief that business will improve, but a broad-based expansion of business activity is not expected in the next one to two quarters.
Figure 5 examines the Future Index by the type of company and end-market, showing again that attitudes are consistent across markets and position within the supply chain. Component and electronic equipment manufacturers remain the most pessimistic, providing mean scores of 4.4 and 4.6, respectively.
Fig. 5: Electronics Supply Chain Future Index by Company Type, Product Area
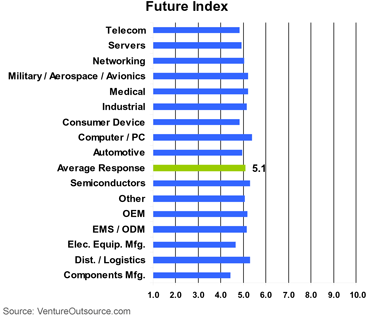
Again, because of their position in the supply chain and the ongoing recession, these scores indicate that they continue to expect unfavorable market conditions at least into 2010.
Responses were also consistent across the different roles in the decision making process, as shown in Figure 6. Regardless of their role in the decision making process, participants responded with some slight optimism for the near-term future state of the electronics supply chain.
Fig. 6: Responses by Role in Decision Making

Those with “some role in the decision making process” had a mean Future Index score of 5.1 out of 10 and those participants who described having “a view into the decision making process” had a mean Future Index of 5.0.
There was a divergence in opinion regarding the current situation. Those with only a view into the decision process provided the lowest mean score for the Current Index, 4.3. Decision makers rated the current situation at 4.5 and participants were most optimistic at 4.8. These results represent a change from the earlier survey, where decision makers were more optimistic regarding the future than respondents with other roles in the decision making process.
These responses possibly show the acknowledgment of how bad the situation has become and that decision makers may be recognizing that a recovery is not likely before the end of the year.
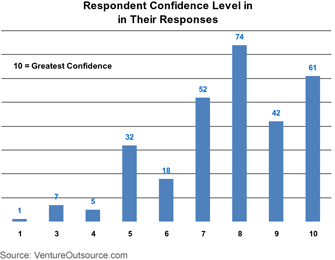
Respondents remain very confident in their responses. In the April survey, 82% of respondents rated their confidence in their answers at 7 or higher out of a scale from 1 to 10. In the August survey, 78% of participants rated their confidence at 7 or higher. (See Figure 7)
Fig. 7: Respondent Confidence Level in Their Responses
Finally, Figure 8 presents the mean increase in respondent’s responses to three primary questions. Regarding the macro environment, respondents, on average, increased their scores between the current and future economic situation and how it impacts their business and the employment situation by 45% and 43%, respectively. These increases were greater than seen in the previous survey.
Fig. 8: Average Increase in Ratings between Current Quarter and Future
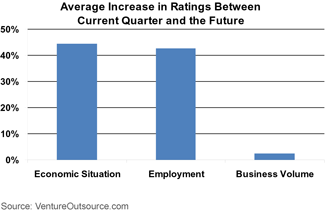
Regarding current versus expected business volume, either sales or purchasing of semiconductors, electronic components, and finished systems, respondents did not expect virtually any change. This is departure from the earlier survey where the mean increase was 23%.
This sobering of attitudes in the supply chain is a critical indicator for how the market will recover, though attitudes on this point vary.
Respondents that target the automotive market actually decreased their scores on average by 7%, regarding future versus current business volume.
Respondents from the networking and military / aerospace / avionics markets increased their responses by the greatest margin, 9% and 13%, respectively.
Other respondents increased their scores for these questions by 2 to 5%, except for the computer / PC respondents who decreased their scores by 1%, on average.
Looking at the business volume question by company type shows semiconductor respondents were the most pessimistic, decreasing their responses by 12%, on average, between their scores for current versus future business volumes. Conversely, electronic equipment manufacturer respondents were most optimistic on this question, perhaps expecting EMS / ODMs and other manufacturers may need to invest in new equipment to continue to turn out new products or to further improve their operational efficiencies.
Component manufacturing and distribution / logistics respondents increased their score, between current business volumes and expected future activity, by a mean of 8%.
EMS / ODMs and OEMs expected business volumes to remain fairly constant, with little change between the current quarter and for the overall year. Respondents from these types of firms make up 68% of the survey, explaining why there was so little change in the current and future business volume question.
Methodology
VentureOutsource.com’s Electronics Supply Chain Business Outlook Survey Summer 2009 was put online and made available to industry clients and Website readers on July 16, 2009. The survey was also sent directly to individuals in electronics corporations, organizations and agencies who use, offer and are employed in electronics contract manufacturing and / or technology supply chain and outsourcing services or subscribe to our opt-in e-newsletter INsight. Survey participation was voluntary. Survey questions designed to define survey respondent demographics did not collect any personally identifying information. The survey closed August 21, 2009. Survey questions focusing on indicators of respondent satisfaction or emphasis were posed with a scoring basis of 1 to 10 (1 = very negative experience or expectations and 10 = very positive experience or expectations) per survey question / criteria.
Future findings
Persons wanting to receive advance notice of future surveys / findings please send an email to insight[at]ventureoutsource[dot]com requesting to be added to our monthly e-newsletter ‘INsight’ or sign-up directly for our monthly e-newsletter on the VentureOutsource.com Website.
VentureOutsource.com content is copyright protected and may not be rewritten, republished, or copied without written permission from the publisher.
Get a list of EMS manufacturers matching your program needs (Its free)
Venture Outsource has the largest, global database of contract electronics capabilities. Get a free list of contract EMS manufacturing companies matching your program needs.
“Was able to very quickly find details on the important elements of setting up EMS and ODM partnerships, talked with an advisor for personalized info on quality providers matching our requirements while getting up to speed quickly about the industry and connect with key staff from like-minded companies and potential partners. Great resource.”
— Jeff Treuhaft, Sr. Vice President, Fusion-IO
Advisors have access to detailed information on listings in our global database and can help you compare provider service capabilities to better match your program needs. Speak with a Provider Advisor. This free service is for electronic professionals working in OEM brand companies.


